Serendip
Serendip is a system for visually exploring topic models generated on large corpora of documents. It was developed by Eric Alexander and Joe Kohlmann at the University of Wisconsin-Madison as part of the Visualizing English Print project.
This tool was presented at IEEE VAST 2014. The associated publication can be found here.
Videos
Before playing around with the tool, it may help to check out some example scenarios that show Serendip in action.
Romeo and Juliet versus Hamlet
Exploring visualization abstracts
Topics in early modern literature
Sample online models
The following links will allow users to play with live, running versions of three sample models that we have built and are hosting on our own server. These models are also included with the Serendip installation (which will likely yield better performance).
Shakespeare_50
This model of 50 topics was built on a corpus of the 36 plays of William Shakespeare. The documents were divided into chunks of 1000 words for the model, and then stitched back together to create full documents. Excluded stopwords as defined by Mallet, as well as additional hand-curated stopwords specific to Shakespeare. Metadata includes title, year, and genre.
Shakespeare_25
This model of 25 topics was also built on the works of William Shakespeare. The documents were divided into chunks of 1000 words for the model, and then stitched back together to create full documents. Apart from the number of topics, this model differs from the first in its list of stopwords, which was not hand-curated but rather includes all words appearing in less than three plays or more than 50% of the 1000-word chunks. Metadata includes title, year, and genre.
VisAbstracts
This model of 30 topics was built on a collection of abstracts from select IEEE sponsored viusalization conferences from 2007-2013, including SciVis, InfoVis, VAST, BioVis, and PacificVis. We standardized the conference names and used various heuristics to remove bibliographic entris for "non-papers." The corpus consists of 1127 abstracts, ranging from 30 to 389 words. Metadata includes title, publication venue, conference, and year.
EarlyModern1080
This model of 100 topics was built on a corpus of 1080 digitized texts published between 1530 and 1799. The corpus was built by randomly sampling 40 texts per decade from a larger archive in an attempt to provide a less biased cross-section than just using well-known texts. The documents have been run through the VARD2 spelling modernizer and annotated with metadata such as title, year, genre, author, and publisher.
Download
Serendip requires Python 2.7.8 for installation. If you don't already have Python or version 2.7.8, you can download it from here.
We have provided an easy_install script to facilitate Serendip's installation. Download this file and run the command python ez_setup.py on the file from the command line to install the necessary installation scripts.
Finally, download this .egg file that contains the latest version of Serendip (along with a few built-in topic models!) and then run the command easy_install on that .egg file:
$ easy_install VEP_Core-1.01-py2.7.egg
This will allow users to run a local version of Serendip on their own machine:
$ serendip
 * Running on http://127.0.0.1:5000/
 * Restarting with reloader
Users can then interact with Serendip's built-in sample models locally by navigating to http://127.0.0.1:5000/ in their browser (preferably Chrome). To build one's own models, see documentation section Building the model.
Documentation
CorpusViewer
The matrix
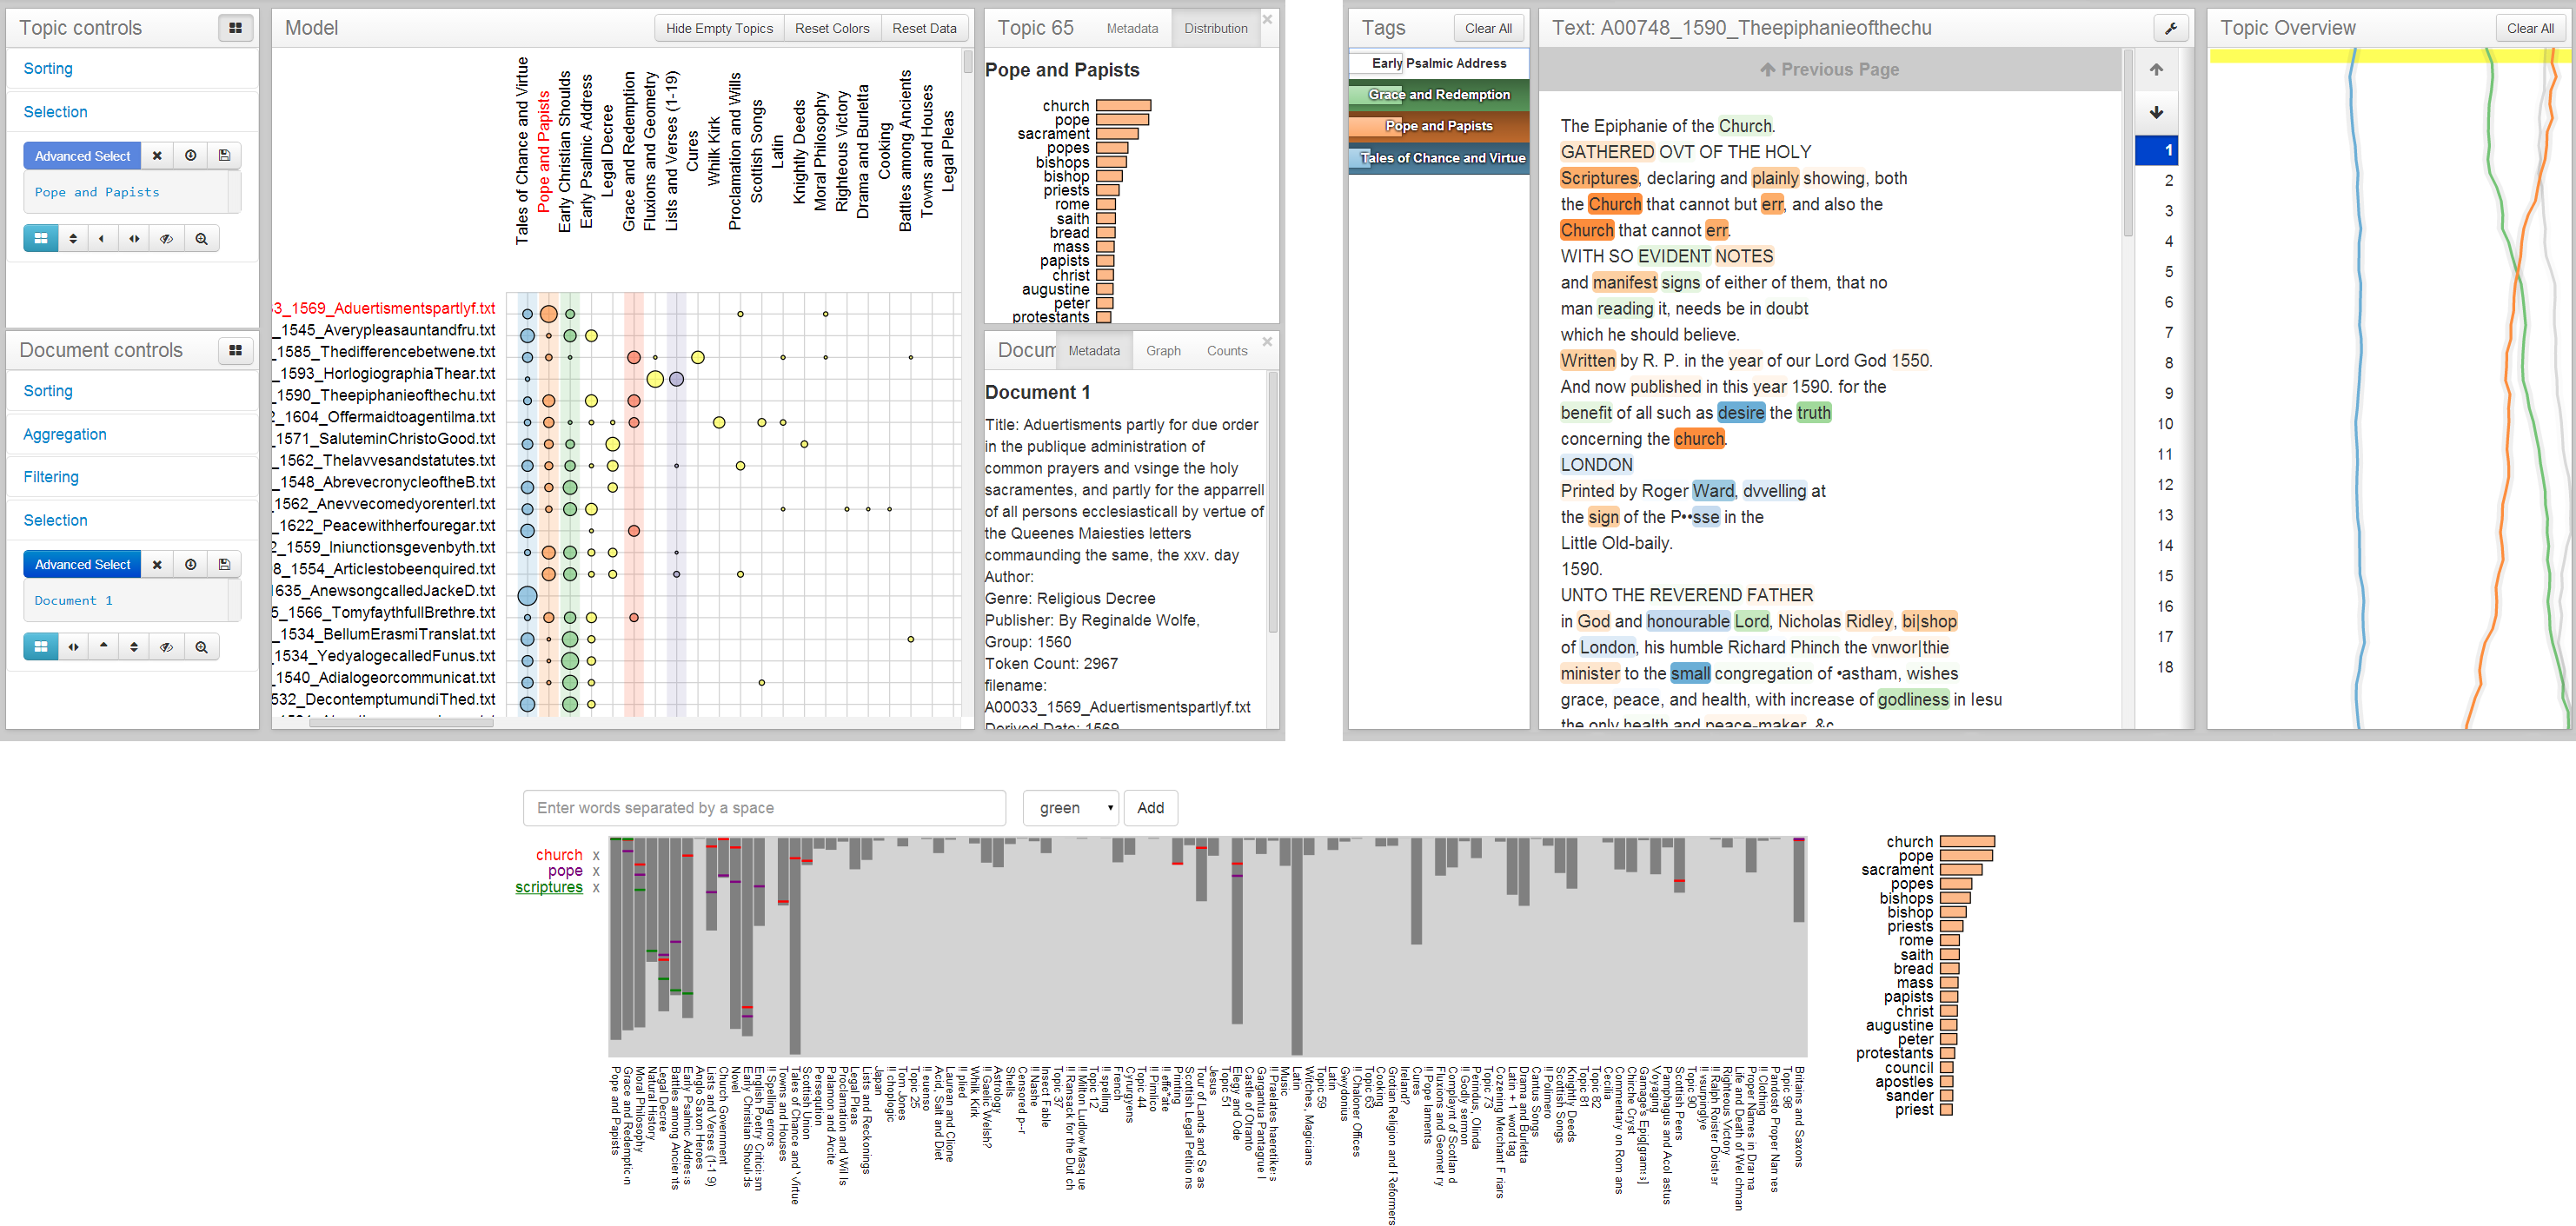
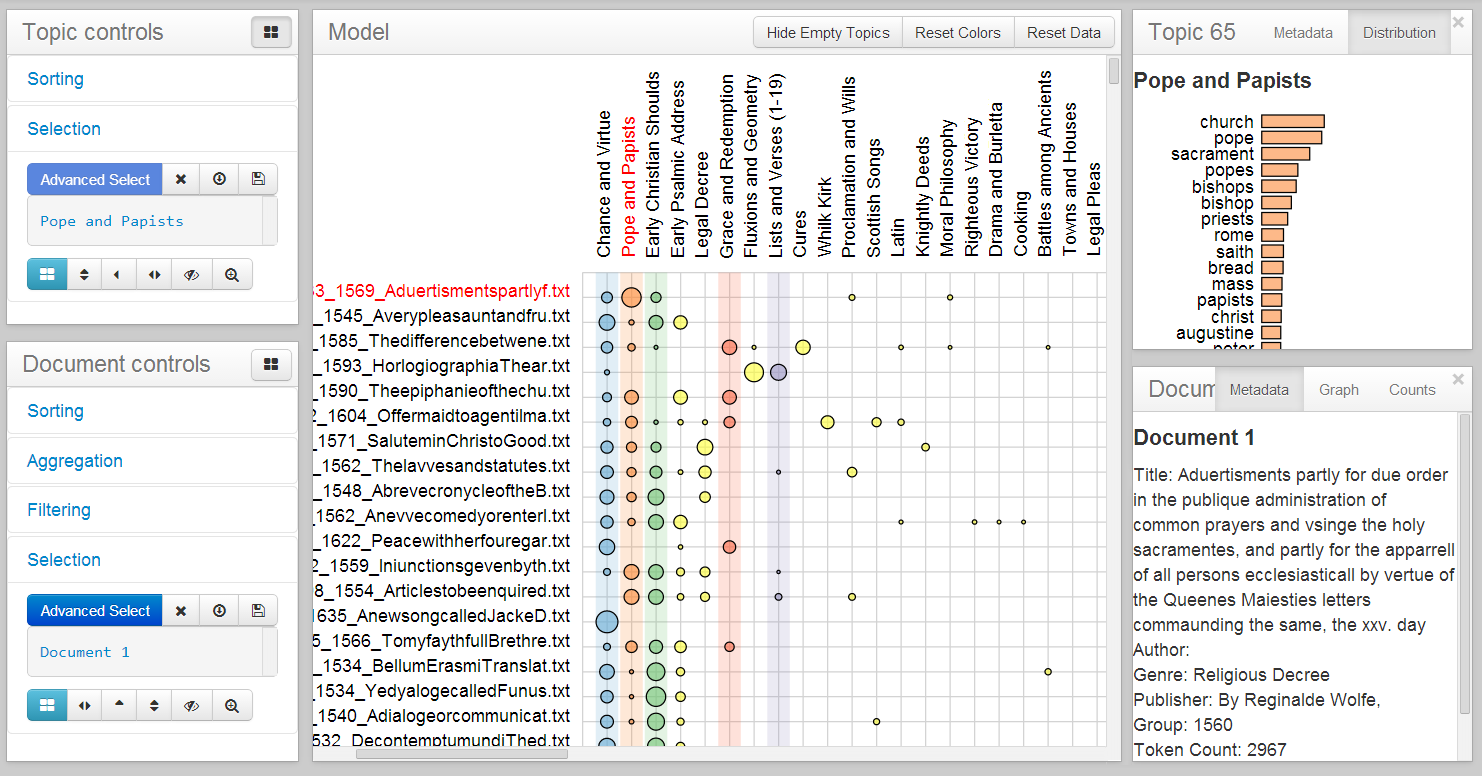
The matrix located in the middle window of CorpusViewer is the primary corpus-level encoding of the system. Documents (along the vertical axis) are plotted against topics (along the horizontal axis). The proportion of each document that is represented by each individual topic is indicated by the size of circular glyphs at the vertices of the matrix. While there are a number of advanced methods for interacting with the matrix in the sidebar controls (see Controls), some interactions are afforded directly within the matrix.
Selecting
Both documents and topics can be selected by clicking on their labels or glyphs. Selecting a topic or document in this manner will:
- display information about it in the corresponding view in the right column
- add it to the corresponding "selection group" displayed in the left column
Selection groups can be interacted with in advanced ways (see Controls) and are highlighted in red. By clicking in whitespace around the labels and dragging, users can select multiple items at once. Clicking in whitespace will clear the selection groups.
Reordering
There are two primary ways of re-ordering the matrix: "Sort by proportion in this row/column" and "Sort by similarity to this row/column." Both of these are available by right-clicking on the row/column label. Users can also reorder by a particular row/column by double-clicking its label.
Individual items can also be manually reordered by dragging the labels.
Annotation
The user can use color to annotate either the documents or topics (though not both at once). To color a particular row/column, right-click its label and select a color from the dropdown context menu. To toggle back and forth between topic colors and document colors, users can use the corresponding toggle buttons () in the Controls column.
Labels
Right-clicking on a topic will give the user the option of renaming that topic. Document labels can be adjusted in the Settings menu ().
Topic view
The window in the upper right-hand corner of CorpusViewer displays information about a topic that the user has selected by clicking on it in the matrix view.
The "Metadata" tab displays statistical metadata about the topic, including its minimum/maximum/mean value, the number of documents containing it, etc.
The "Distribution" tab displays the top-ranked words in the topic, with horizontal bars indicating each word's proportion within the topic. Ranking type and number of words to display can be changed in Settings. Clicking on a particular word will open a new tab of RankViewer displaying that word's topic rankings.
Topics can be renamed by double-clicking on the "Topic #" heading next to the "Metadata" and "Distribution" tabs.
Document view
The window in the lower right-hand corner of CorpusViewer displays information about a document that the user has selected by clicking on it in the matrix view.
The "Metadata" tab displays whatever metadata Serendip has access to for the given document.
The "Graph" tab displays a miniature version of the document's line-graph overview, indicating the behavior of individual topics over the course of the document. (See TextViewer overview documentation.)
The "Distribution" tab displays the most prevalent topics contained within the document as a bar chart.
Documents can be opened in TextViewer by double-clicking on the "Document #" heading next to the tabs.
Controls
Topic controls
This window provides advanced controls for interacting with topics in the matrix view.Sorting
There are four "blind" ways of ordering the topics of the matrix: by metadata, by ANOVA, by contrast between categories, and custom.
- Ordering by metadata - This dropdown menu allows users to sort topics in descending order by a variety of statistical metadata, from number of documents to mean/median/variance/etc.
- Order by ANOVA - This button will sort topics by their ability to distinguish documents based on a particular field of metadata. For instance, selecting "Genre" in the Order by Metadata dialog box would bring topics that have the greatest variance across genres.
- Order by Contrast - This button will sort topics by their ability to distinguish between specific groups of documents demarcated by categorical metadata. For instance, we might be interested in topics that are best at distinguishes comedies from the rest of the documents.
- Custom Order - This button will bring up a dialog box in which the user can provide their own arbitrary ordering of topics in the form of a comma-separated string of topic numbers.
Selection
This controls menu provides a number of ways of building and interacting with selections of topics.
- Advanced Select - Brings up a dialog box containing advanced settings for selecting topics based on metadata.
- Clear selection - Unselect all topics.
- Load group - Select a previously saved group of topics.
- Save group - Create a name to be associated with this selection that can be re-loaded later.
- Color group - Pick a color to apply to this group of topics.
- Sort documents by group - Reorder the documents in descending order of highest prevalence of the topics in the selected group.
- Move group to the left - Move the selected topics to the left side of the matrix.
- Sort topics by similarity to group - Sort topics by their similarity to the topics in the selection. (Acts on cosine similarity to a mean vector created by averaging topics in group.)
- Hide group - Remove selected topics from the matrix.
- Hide all but group - Remove all topics not in selection from the matrix.
Document controls
This window provides advanced controls for interacting with topics in the matrix view.
Sorting
There are three "blind" ways of ordering the documents of the matrix: by metadata, by nth topic size, and custom.
- Ordering by metadata - This dropdown menu allows users to sort documents in descending order by any metadata fields to which Serendip has access.
- Ordering by nth topic - This is a way of getting at topic diversity. For example, ordering by size of the first largest topic will favor single-topic documents; ordering by size of the second largest topic will favor two-topic documents; etc.
- Custom Order - This button will bring up a dialog box in which the user can provide their own arbitrary ordering of documents in the form of a comma-separated string of document numbers.
Aggregation
To battle scale and afford comparison of groups, Serendip allows users to aggregate groups of documents using document metadata. Users can aggregate by categorical metadata (in which case a group of documents will be created for each distinct value of the field) or by numerical metadata (in which case the user can choose numerical ranges to be aggregated).
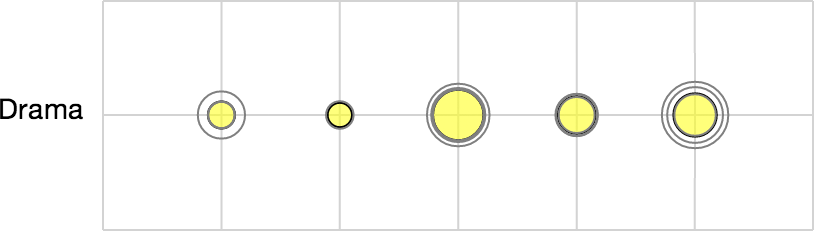
When documents are aggregated, their rows will be combined into a single row for each group with a new set of glyphs. The filled circle in each glyph indicates the mean value of that topic within the group. The un-filled circles in each glyph indicate the interquartile range (IQR) of the values of that topic within the group. In other words, glyphs containing spaced out circles like a target indicate a wide variance of a particular topic within the group; tighter concentric circles indicate more consistent behavior of the topic within the group.
Filtering
This controls menu provides the user with the ability to filter out specific documents using metadata queries. Multiple queries can be combined. As of now, multiple queries will simply be intersected together.
Selection
This controls menu provides a number of ways of building and interacting with selections of topics.
- Advanced Select - Brings up a dialog box containing advanced settings for selecting documents based on metadata.
- Clear selection - Unselect all documents.
- Load group - Select a previously saved group of documents.
- Save group - Create a name to be associated with this selection that can be re-loaded later.
- Color group - Pick a color to apply to this group of documents.
- Sort topics by group - Reorder the topics in descending order of highest prevalence of the documents in the selected group.
- Move group to the top - Move the selected documents to the top of the matrix.
- Sort documents by similarity to group - Sort documents by their similarity to the documents in the selection. (Acts on cosine similarity to a mean vector created by averaging documents in group.)
- Hide group - Remove selected documents from the matrix.
- Hide all but group - Remove all documents not in selection from the matrix.
Automatic coloring
This controls menu allows users to automatically color groups of documents that are grouped by categorical metadata.
Settings
Extra settings can be adjusted using the wrench icon () in the upper right-hand corner of CorpusViewer.
Document Labels: The default behavior labels each document with a unique ID number, but documents can also be labeled by any arbitrary field of metadata.
Topic Representation: These settings control the display of topics within the Topic view. The Topic view will display the top n words from a topic as ranked by the chosen ranking type. For a description of different ranking types, see the paper.
Aggregation glyphs: To indicate the fact that aggregates are groups of documents, the size of their glyphs are multiplied by an optional scaling factor, defined here.
TextViewer
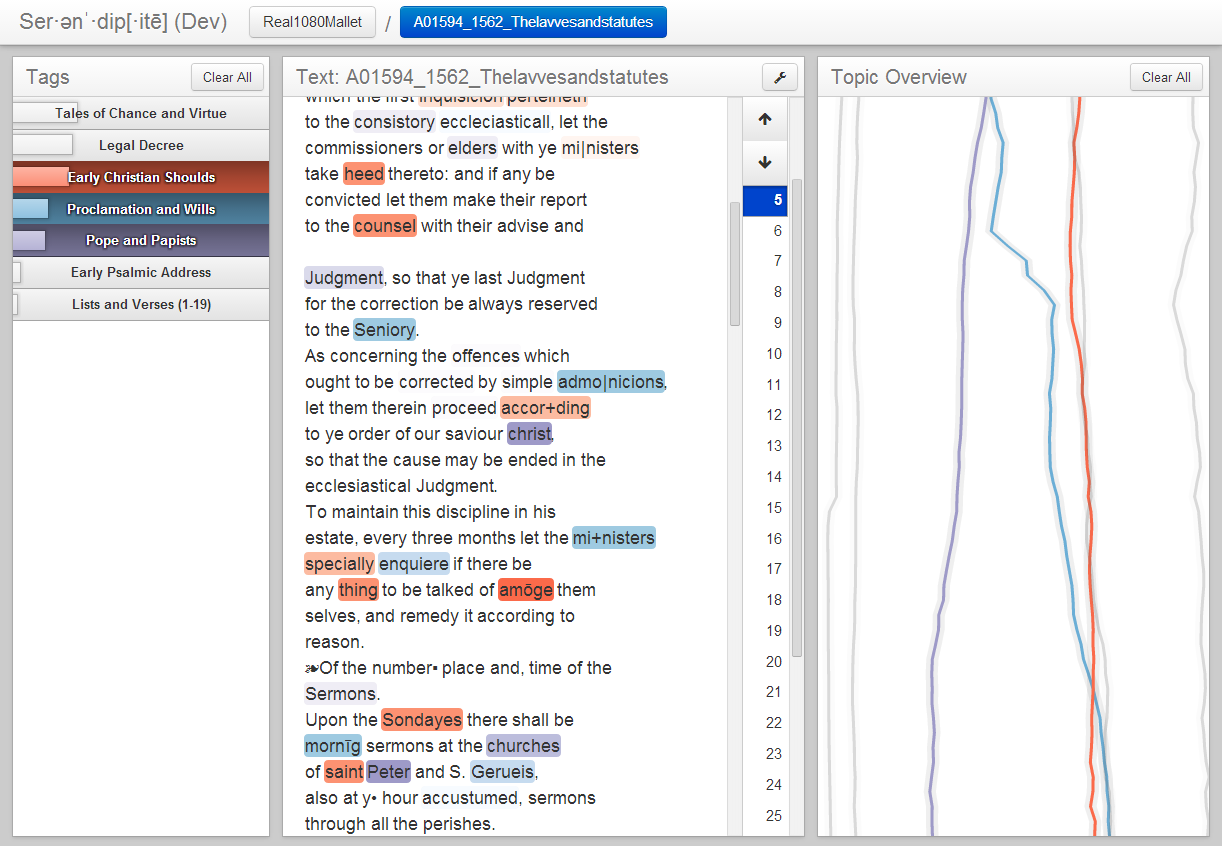
The topics
The topics contained within the document are displayed in the left-most column in descending order of frequency. The size of the bar in each topic label indicates the proportion of that topic. Clicking on these topics will toggle them on and off. Toggled-on topics will be given colors that will correspond to tags within passages, lines in the document overview, and topic colors in CorpusViewer.
Right click to a topic label to see its distribution of words across the vocabulary in a dialog box.
The text
In the middle of TextViewer, we can read the text of the document itself! We apply colored tags to indicate the topic of each word. A word's tag will only be visible if its corresponding topic has been toggled on. Darker tags are applied to words with higher "saliency" within their topic, while lighter tags indicate words with relatively low "saliency." (For a thorough description of saliency--a combination of frequency and information gain--see the paper.)
Clicking on an individual word will open a new tab displaying that words behavior across topics with RankViewer. Right-clicking on an individual word will toggle that word's topic on or off.
If the document has been paginated for better performance, the user can scroll amongst pages using the controls on the right.
The overview
In the right-most column, TextViewer contains a line-graph overview indicating the behavior of each topic over the course of the document. The vertical axis corresponds to position within the document (top=beginning of document, bottom=end of document), while the horizontal axis corresponds with density of a topic within the passage centered around that position. The varying topic densities are indicated by color-coded lines, one for each topic.
Clicking the whitespace at a particular position in the overview will automatically scroll the document to the corresponding passage or page.
Clicking directly on a topic's line will toggle that topic on or off.
RankViewer
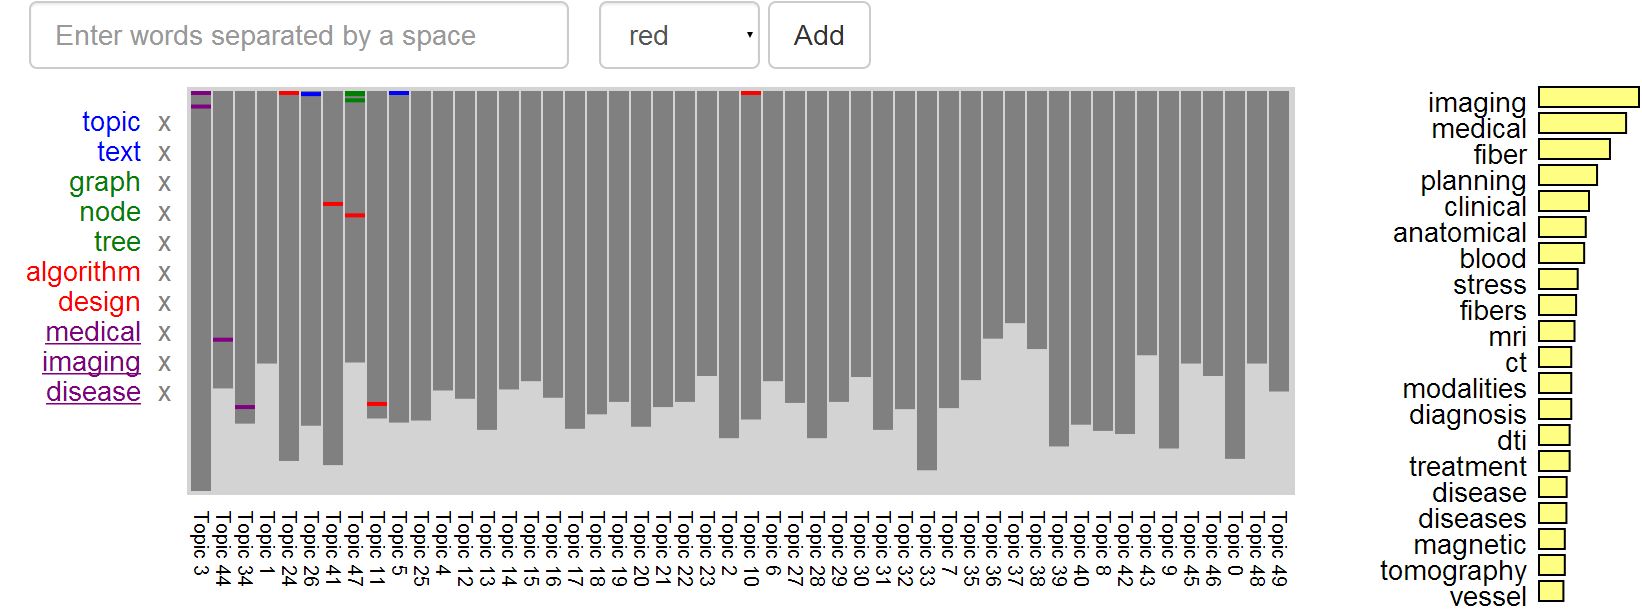
RankViewer provides a way of seeing which topics contain individual words, as well as comparing the rankings of multiple words. Within this visualization, gray bars correspond with each topic, their size indicating the relative size (i.e. the number of words contained). Color coded lines within these bars correspond to the ranking of individual words that have been indicated for analysis, either by clicking on them in TextViewer or CorpusViewer, or else by manually searching for them within RankViewer. Words that are highly salient within the topic will be represented with lines near the top; low-saliency words will appear near the end/bottom of the topic ranking(s).
To add additional words to the analysis, the user can type them into the search bar, separated by spaces. The dropdown menu lets the user define the color for their searched words. After words have been added to the visualization, they will appear (color-coded) in the list on the left, and can be removed by clicking the corresponding "X". Brushing over these word labels will highlight that word's positions.
The topics are sorted by combining the rankings of the underlined words. Clicking on a particular word will sort the topics by that word. Right-clicking on words will allow the user to sort the topics by multiple words.
Clicking a topic bar will display the topic's word distribution on the right.
RankViewer Example
Building the model
Building one's own models requires having already installed MALLET (UMass-Amherst's MAchine Learning for LanguagE Toolkit). Details for downloading and installing MALLET can be found here. Once MALLET has been installed, users can build their own models to explore in Serendip using the vep_tmbuilder command. This will call a script that will build a topic model using MALLET on a provided corpus and parse the model into Serendip's native format.
Training topic models can be tricky, and there are a variety of parameters that the script can take. The parameters are listed here:
--corpus_name: This is a name specifying the corpus.--corpus_path: The full path location specifying the directory of the corpus of text files. Required unless the corpus is already in Serendip's Corpora directory.--model_name: The name of the model to be built. If no name is specified, will default to the corpus name.-for--forceOverwrite: This option force overwriting of previous corpus/model with the same name, if it exists.-mSor--malletStopwords: If included, this parameter will tell the topic model to ignore all words in MALLET's built-in stopword list.-eSor--extraStopwords: This parameter allows the user to specify a file of extra stopwords to be ignored by the model.--chunkSize: This allows the user to seperate documents into smaller chunks. If a value is given, Serendip will cut documents into chunks of the given number of tokens, run the model, and then stitch the chunks back together. If no value is provided, the model will treat each document as a whole.-nor--numTopics: The number of topics to inferred by the model.-ior--numIterations: The number of iterations to be run by the modeler. More iterations will generally yield better results.-aor--alpha: alpha parameter for the model. If not supplied, will use MALLET default.-bor--beta: beta parameter for the model. If not supplied, will use MALLET default.-ror--randomSeed: starting random seed for model iterations. Can be useful for reproducibility.-oIor--optimizeInterval: MALLET parameter specifying iterations between parameter optimizations. Not required.-oBIor--optimizeBurnIn: MALLET parameter specifying iterations before first parameter optimization. Not required.-sTIor--showTopicsInterval: Number of iterations between displaying topics to console.--outputSerendip: Tells MALLET to only output files needed by Serendip. Either this oroutputAllmust be specified for Serendip to function properly.--outputAll: Tells MALLET to output all potential files. Either this oroutputSerendipmust be specified for Serendip to function properly.--htmlPageSize: The number of tokens per page of html as displayed in TextViewer. Default is no pagination', type=int)
Here is an example of what building a model might look like:
$ vep_tmbuilder --corpus_name WorksOfShakespeare --corpus_path C:\Users\Me\Documents\Shakespeare\ --model_name Shakespeare_50 -mS -eS shakespeareanStops.txt --chunkSize 1000 -n 50 -i 1000 --outputAll
Making these models easy to build and run is a work in progress. If you have any questions about these parameters or the script, please do not hesitate to contact us.
About us
Serendip was developed at the University of Wisconsin-Madison as part of the Visualizing English Print (VEP) project. The primary goal of the VEP project is to investigate ways of using data visualization principles to study literature from the Early Modern period (roughly the 15th to the 18th century).
The system was primarily authored by Eric Alexander and Joe Kohlmann, under the advising of Professor Michael Gleicher. Significant contribution was provided by Mike Witmore at the Folger Shakespeare Library in Washington D.C.
Serendip has appeared in a number of places to date. Most recently, a paper titled Serendip: Topic Model-Driven Visual Exploration of Text Corpora was presented at IEEE VAST 2014 in Paris. Before that, an early version of the system appeared as a poster at IEEE VIS 2013. Serendip was also highlighted in a demo at the Chicago Colloquium on Digital Humanities & Computer Science.
This work was supported in part by NSF award IIS-1162037 and a grant from the Andrew W. Mellon Foundation. The code for Serendip is open-source under the BSD license.
Have any questions or comments about Serendip? Feel free to contact us!